Tuesday, September 23, 2008

Barplot function in R

Much of my backtesting platform is text driven. Not that I'm opposed to graphs...just felt my time was better spent developing the foundation for the platform before adding bells and whistles. Little did I realize how difficult it is to find a simple graphing engine for the platform. Problem is...I'm old school...couldn't care less about flash graphs. Keep it simple.

Since I'm using python...figured I had to give the matplotlib library a try. It is nice...simple...but something was missing. Couldn't put my finger on it. So, dug around and played with the R language plotting libraries. A bit more my speed...though a bit particular in the settings. Anyway, here's a function I wrote to generate bar charts using R with a replacement for pie charts in mind...


#-----------------------------------------------------------------
# Simple bar chart - use instead of pie chart when possible.
#-----------------------------------------------------------------
barPie <- function(xSeries, chTitle="Your Bar Chart", xLab="X Label",
xDesc="%")
{
xSeries <- sort(xSeries)

# save off original settings in order to reset on exit
oldPar <- par(no.readonly=TRUE)

plot.new()

# set page margins in inches
par(mai=c(1,1.5,1,1))


# pad 30% for labels
# start plotting at 0.0 unless negative
if (min(xSeries) < 0.0)
{
xLim = c((min(xSeries) * 1.3), (max(xSeries) * 1.3))
}
else
{
xLim = c(0.00, (max(xSeries) * 1.3))
}

# horizontal barplot in color baby!
bp <- barplot(xSeries, horiz=T,
xlab=xLab, las=1, col=rainbow(length(xSeries)),
xlim=xLim,
axes=F, cex.names=0.7, main=chTitle)

# if x negative then start label at 0.0
# otherwise, start label at value of x.
xVals = ifelse(xSeries < 0.0, 0.0, xSeries)
text(xVals, bp, paste(xSeries, xDesc, sep=""),pos=4, cex=0.65)

# format x axis
xRange <- formatC(pretty(xSeries), 1, format="f")

axis(1, at=xRange, labels=as.character(xRange), cex.axis=0.75)
box()

#restore par value to previous state
on.exit(par(oldPar))
}


Used data from my portfolio to plot sector allocations and called the function...

sectors <- c(10.64,119.83,162.66,66.48,71.78,35.44,32.77,161.17,53.91,
101.81,53.38,231.45,31.24,103.01)
sectors <- round((sectors/sum(sectors)*100.00), 1)

# write to png driver
png("c:/taylortrade/rlang/sectors_test.png")

barPie(sectors, "Sector Allocation", "Pct Allocated")

# stop writing to png driver
dev.off()


And here's the result...

What I'm Researching...


Visualize real-time data streams with Gnuplot

Posted: 22 Sep 2008 11:26 PM CDT

perl script feeding Gnuplot to plot streaming data in real-time. Interesting find...hat tip to Hackszine.com

The plotrix Package (pdf)

Posted: 22 Sep 2008 10:21 PM CDT

need to review this...looks like an all encompassing plotting package for the R language. Barcharts, piecharts, gantt charts, oh my!

Monday, September 22, 2008

What I'm Researching...


Writing R Extensions (pdf)

Posted: 21 Sep 2008 09:28 PM CDT

the how-to of creating extensions to the R language.

The Hazel Tree - A Python Compendium

Posted: 21 Sep 2008 07:21 PM CDT

central location of texts covering python.

The fTrading Package (pdf)

Posted: 21 Sep 2008 06:25 AM CDT

R language package containing functions for ohlc plots, sharpe ratio, sterling ratio, maxDrawDown, rolling analysis, ema, sma, emwa, etc.

Sunday, September 21, 2008

What I'm Researching...


Quick-R: Home Page

Posted: 21 Sep 2008 01:37 AM CDT

nice site covering all the R essentials - reading data, graphing, stats.

R mailing lists archive

Posted: 21 Sep 2008 01:28 AM CDT

search the R language mailing list.

Rtips

Posted: 21 Sep 2008 01:26 AM CDT

cookbook of the R language

Producing Simple Graphs with R

Posted: 20 Sep 2008 10:47 PM CDT

examples of various charts (line, bar, pie, dot, histogram) in R language

Creating Charts and Graphs with GNU R

Posted: 20 Sep 2008 10:45 PM CDT

brief tutorial covering pie, bar, scatter, and line charts in R language.

R Graph Gallery :: List of graphs

Posted: 20 Sep 2008 10:26 PM CDT

great gallery of R Language graphs.

R Graphical Manual

Posted: 20 Sep 2008 10:16 PM CDT

gallery of R language graphics by category such as Finance, Econometrics, SocialSciences, etc.

R Graphics

Posted: 20 Sep 2008 10:13 PM CDT

book on the graphics available with the R language. Very nice!

Chart of R Colors

Posted: 20 Sep 2008 10:12 PM CDT

table of colors available in R language.

Using Color in R Language (pdf)

Posted: 20 Sep 2008 10:10 PM CDT

showcases all the colors available in graphing with the R language.

Getting Started With Matplotlib's OO Class Library

Posted: 20 Sep 2008 08:34 PM CDT

brief summary of matplotlib's api.

Using Python for Interactive Data Analysis

Posted: 20 Sep 2008 08:26 PM CDT

Several excellent examples of using numpy and pylab (matplotlib) together.

scienceoss.com » Blog Archive » Creating a custom bar plot in matplotlib

Posted: 20 Sep 2008 03:33 PM CDT

interesting code examples of bar charts in pylab.

Friday, September 19, 2008

What I'm Researching...


Python: package matplotlib

Posted: 18 Sep 2008 11:20 PM CDT

api reference for matplotlib - not a cookbook of examples - just command and descriptions. Use as reference guide.

Plotting with Pylab - python

Posted: 18 Sep 2008 11:13 PM CDT

drop-dead example of plotting with pylab versus matplotlib's api. would like to use pylab's api...if at all possible.

Sofeng's Blog: Simplistic Python Thread example

Posted: 18 Sep 2008 11:02 PM CDT

drop-dead example of threading in python.

Sofeng's Blog: How to use *args and **kwargs in Python

Posted: 18 Sep 2008 10:59 PM CDT

drop-dead simple explanation of variable length argument lists in python.

Sofeng's Blog: Emacs 22 Command Index (sorted by Category)

Posted: 18 Sep 2008 10:58 PM CDT

breakdown of emacs commands - not sure if format is the best...but worth saving for future.

Sofeng's Blog: Example pie charts using python and matplotlib

Posted: 18 Sep 2008 10:38 PM CDT

really like the look of these pie charts. use for sector allocation page.

Sofeng's Blog: How to draw a simple line using python and the matplotlib API -

Posted: 18 Sep 2008 10:34 PM CDT

drop dead simple example of using matplotlib.

Goldblog - Python - Creating Bar Graphs with Matplotlib - Corey Goldberg

Posted: 18 Sep 2008 10:20 PM CDT

example of bar graph in python. like the format of the graph.

Vim is a beautiful tool

Posted: 18 Sep 2008 01:04 PM CDT

nice summary of the top shortcuts used in vim.

Thursday, September 11, 2008

Portfolio Performance for August 2008

Some very nice weather happening here in Missouri. In fact, in all my life I've never had weather like this in August/September timeframe.

Back in Texas, it's usually some of the hottest times of the year. But, feels like Fall already in Mid-Mo.

Can't wait to see the leaves turn colors. Of course, my kids are looking forward to piles of leaves to jump and play
in.

Maybe this weather change will bring the market out of the doldrums. By the way, the picture above was taken while visiting the Devil's Ice Box.

And now for the August returns...


Still, nothing going on with the market or the trading system. Though, plenty to do with the system testing platform. I'm exploring the numpy library for python to determine how big a role this library should play in the platform's architecture. For those curious...check out my delicious bookmarks on numpy.


Later Trades,

MT

Thursday, August 21, 2008

Sector Allocations for August 2008

Quick look at the sector allocations for the portfolio. Please note that cash is not included in the breakdown. Next on my development list.

MT

Saturday, August 09, 2008

Portfolio Performance for July 2008

July ended with a surgery for yours truly. I had my gallbladder removed. I had a rough few days of recovery but starting to feel normal again.

I had a set back this month in regard to the testing platform. The redesign has severely extended the simulation runtime. So, I've spent much of my time finding the bottlenecks of the code and determining the optimal solutions. Very thankful python has such great profiling tools at the ready.

You know, performance tuning code is sure a lesson in humility. All my years of programming...I feel I should have a good handle on the slow areas of my code. It only takes a profiling report to show how wrong I am.

Very similar to trading the market. Trading decisions are based on our experience. Where we think the money-making opportunities are. Only takes a simple backtest to showcase how wrong we are.


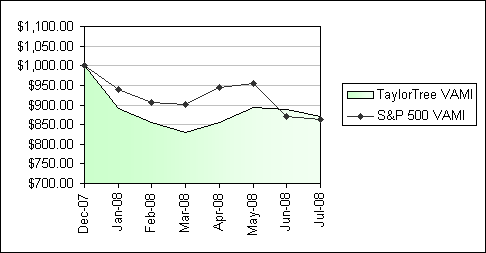
And with that...some charts for the month of July...


Not a whole lot of movement in the portfolio occurred the month of July. Just another month of sitting and waiting. Letting the system do what it does best...waiting for the market's next move.

Later trades,

MT

Tuesday, July 08, 2008

Portfolio Performance for June 2008

June was a great month for the family. My major project came to a successful close. And with that a huge amount of time freed up. With that, we made our first trip back to Texas in 2 years. It was a very nice visit. We were able to see family, play on the lake I grew up on, and enjoy some much needed Texas culture.

June wasn't as great for the portfolio. But, did manage to beat the market for the month by a fairly large margin putting us in the lead for the first time this year. I believe a big reason for this outperformance was due to the pulling of weeds back in March and April. This allowed new positions to take hold in the portfolio garden.

Goals for the month of July?
  • Complete the upgrade that will enable testing of multiple systems against a common portfolio. This will allow exploration of various allocation methods. And judge the effects of merging long-term systems (trend capturing) with short-term systems (volatility harvesting).
  • Wrap-up the upgrade that allows ranking of signals and existing positions in order to initiate trades.
  • Modify how cash is tracked in the testing platform. Currently, cash is a static variable. Goal is to convert cash into a unit series to enable dynamic pricing. This will enable sweep accounts in the portfolios. And allow the switching of cash instruments.

Later Trades,

MT

Monday, June 02, 2008

Portfolio Performance for May 2008

I've been neck deep in one heck of a massive project at work. Today is the first day in months that I've got a breath. And with that breath, I figure I'd post the portfolio's performance from the past few months.


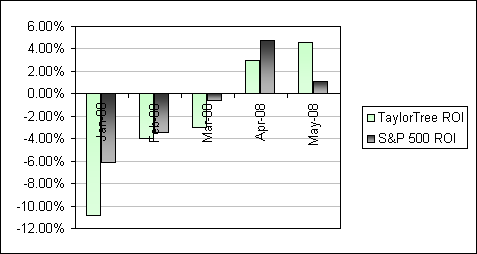
As you can see, the past two months have been the best months of the year for the portfolio. Still not great...but much better than before. In fact, in the chart below, you can see the portfolio's monthly return finally beat the market for the first time this year.


You might have noticed a change in the charts from the prior month's reporting. That's due to a change in Icarra's chart rendering methodology. This new methodology proved more difficult to post images to this blog. So, I rolled my own portfolio software. Which is definitely a work in progress. Over time, I hope to develop the capabilities to track and share more details on trade statistics from this software.

My ultimate goal is to merge my backtesting application with this portfolio software. This way I could compare simulated results with real-time performance.

What are my next investment experiments?
  • I'm curious how the elements of permaculture can be used in selecting investment vehicles for the portfolio.
  • Would Janet Brown's investment methodology improve my system results?
  • When receiving a large number of buys for a given sector...is it better to buy as many stocks as I can under my risk limits? Or more appropriate to opt-out of all the individual stocks and buy an ETF in that sector to capture the obvious sector-based trend?
  • Measuring systems that utilize different levels of cash throughout their system life cycle. If system A's performance is better at all conventional levels (Sharpe, ROI, etc.) than system B's...yet system B uses 50% less cash...are the comparisons valid? I don't believe so...but how do you compare then? Via converting unused cash to utilize market-based returns? This is a tough one.
That's it from here where we've had so much rain in Missouri that I'm beginning to think I'm back in East Texas.

Later Trades,

MT

Tuesday, March 04, 2008

Portfolio Performance for Feb 2008

Another month in drawdown. This is where the lesser experienced would begin to question the validity of their system. Has something stopped working? Did the market change? If you design your strategy based on a helter skelter of methodologies...you may have a point.


But, if you build your system based on capturing the market's inherent behavior: stocks can exceed 100% returns but never exceed 100% loss (unless on margin). Then you know when the market turns south...you'll turn south. Nothing you can do but weather the storm. The fortunate thing is you have allocated your money based on this knowledge...that there will be storms. And you must wait for the storm to pass...the skies to clear...and the markets to return.

Below are the sector breakdowns for the portfolio. The cash level increased 35% from last month's level. Again, the increase in cash will reduce the portfolio's drawdown should the market continue to stall. But, decrease our returns should the market recover.


In fact, you can see in the chart below the difference the cash level is making to the portfolio.


February's drawdown is beginning to slowdown in comparison to the benchmark. As we move further and further into the market's downturn...the portfolio will begin to break off from the benchmark due to the rising cash level.

This rising cash level is due to 29% of the portfolio's positions hitting trailing stops since Jan 1st. In that same timeframe, our new new positions increased by 4%. Is this good or bad? Neither. Just the way the market works.

On a side note...the weather here in Missouri is toying with us. You can tell spring is trying to push it's way in...but the winter isn't giving up without a fight. Crazy thing to be riding bikes in short-sleeves one day and bracing for snow the next. Markets and weather...what fun.

Later Trades,

MT

Sunday, February 03, 2008

Portfolio Performance for Jan 2008

I would like to have done a better job at my first portfolio performance post. But, I'm afraid I've been extremely busy at my day job. So, please be patient. My hope for future performance posts is to include much more information about the returns and portfolio breakdown.


One of the difficult items I've found in preparing for posting of portfolio performance is the lack of good tools. I've tried quite a few products the past few months and was about to give up hope until I found Icarra. Sweet product. One of the hardest things to create is a simple product. So many developers miss the mark...the tendency is to focus on the bells and whistles. Icarra hits the mark with it's great charts, sector breakdowns, and ease of trade entry.

This is a good segway into developing a portfolio. As an investor, you have unlimited choices. Question to ask yourself...do you focus on the bells and whistles? Or do you hunker down and keep your choices simple...your strategy simple. If you find yourself changing your portfolio on every market downturn just because you feel like you should be doing something...then maybe it's time to refocus. Are you really improving your portfolio returns? Or just keeping yourself busy?

Now, back to portfolio performance. There are some things to note. I have not entered my actual entry prices into Icarra. Just too much data to sift thru in order to accomplish that. Instead, I have entered all the positions as if I bought them on the last day of 2007 (12/31/2007). From this point forward I will enter all sells, new buys, dividends, interest, etc. into Icarra. But, keep in mind...all performance is based on the clean slate of 2008.

Below is the breakdown of sectors in the portfolio. This is one area that I found some differences in the chart and the actual breakdown in Icarra. But, useful nonetheless. I'll contact Icarra to find the reason for the difference and post in the next performance release.


You can see, I now have a very large cash position in the portfolio. I don't like this, I have to admit. This will cause the portfolio to lag should the market gain back momentum. But, this is the normal process of the system. During market downturns like we've had...the trailing stops are hit and the bugs in the portfolio are killed. Then we have the waiting game for new signals. The goal, of course, is to be 100% invested in the market...that is what generates our returns. But, all seasons have their winters...and this is where we bundle up and wait for the ice to melt.

Another area I want to point out in the sector breakdown is the lack of consistency in the sector weightings. My goal is to have a better balance in the sector weightings. These sector weightings cannot always be controlled due to the nature of the system's signals. Some sectors may be very cold and other sectors can be very hot. Based on the weightings above, the services sector was pretty hot for 2007....and have held up relatively well in the portfolio during our bug killing in the recent market downturn.

Finally, I want to review the monthly returns of the portfolio...


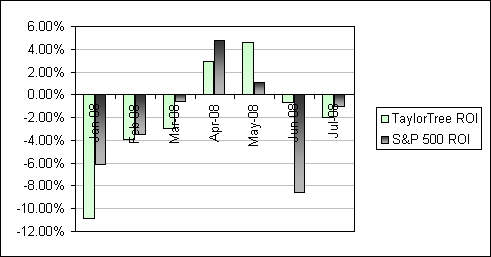
Pretty large differential between the portfolio's monthly returns and the S&P 500's. The system is more volatile than the market and as result drawdowns and gains are larger. This is par for the course with trend following systems in general. It takes a lot of patience to trade a trend following system. Especially, a long-term trend following system. But, I truly believe, that's where the returns are in the long-term.

Can this be improved? Possibly. There are ideas I have yet to test that could trim the portfolio's volatility. And hopefully, I'll get a chance to test these ideas in the months to come.

If you have any questions or would like to see other aspects of the portfolio...drop me a line.

Later trades,

MT

This post is for information and entertainment purposes only. Under no circumstances does this information represent a recommendation to buy or sell securities or any other type of investment instruments.

Wednesday, January 16, 2008

Quote of the Week - 01/16/2008

Transcontinental Railroad Completed
The last spike of the transcontinental Railroad is driven at Promontory, Utah in 1869.

"Look at a stone cutter hammering away at his rock, perhaps a hundred times without as much as a crack showing in it. Yet at the hundred-and-first blow it will split in two, and I know it was not the last blow that did it, but all that had gone before." -- Jacob A. Riis
MT

Sunday, January 06, 2008

Quote of the Week - 01/06/2008

"Risk is trying to control something you are powerless over." -- Eric Clapton


Hope your first week of the new year was a good one. I've spent a bit of time planning out the new year (talk about your risk). One of the first items on the agenda is a visit back to Texas to see the family. In addition, some changes will come to the blog.

My testing platform development is coming to an end and I should have more time to research and discuss portfolio ideas/strategies. So, each month I plan to review my personal portfolio composition: returns, drawdowns, sector breakdowns, you get the picture. The first few postings will be a bit raw...but hopefully over time they will improve as will the returns.

Later Trades,

MT

Tuesday, January 01, 2008

Quote of the Week - 01/01/2008

"I sometimes meet people who say, I'm going to be this and I'm going to be that. You feel kind of bad for them because they're limiting themselves. It's different from having an enthusiasm for something and seeing where life takes you. I feel lucky to never have planned to go into what I did. I always said, "All I want to do is make things, whether it's drawing or writing." If I'd said, "I'm going to be a director," it probably wouldn't have happened." -- Tim Burton


Tim's quote is a great one to start the new year. Focus on what you enjoy and let life handle the details.

Happy New Year!

MT

Wednesday, December 26, 2007

Quote of the Week - 12/26/2007


"Pick a mountain in life to climb and don't stop til' you reach the top. When you reach the top...be lookin' for the next mountain to climb." -- Life philosophy of Helen Taylor
My Mom died 6 years ago today. I lost track of the times I heard from her, "climb that mountain", when life turned difficult. And the many times I responded, "I'm tired of climbing."

Never would have thought her mountain mantra would have such an impact in my life. That recalling those nagging words would continue to push me forward in life. Even after she's gone.

Still an inspiration, after all these years.

Thanks, Mom.

Mike

Tuesday, December 25, 2007

Merry Christmas - 2007


The picture above is from December 2006. Our first snow in Missouri. There is a bit of snow on the ground today...but quickly melting. We may have more snow tomorrow.

Hope everyone is having a great Christmas. I've spent my time drinking coffee my daughter gave me and putting together all the presents for the kids. Next step is grilling some nice tenderloins wrapped in bacon. No thoughts about the markets or programming. Just kicking back and enjoying the day.

Oh, and very thankful for the great gift a friend of mine gave me last year. I've never owned a cordless drill before. A friend of mine felt sorry for me and gave me a full set of Dewalt cordless power tools. All these years I've been cussing at putting toys together...until now. Wow, what a difference Dewalt makes. Thanks, buddy!

MT

Monday, December 17, 2007

Tuesday, December 11, 2007

To Design or Code?

"The one who does the work decides." -- KDE principle
Jeff Atwood over at the Coding Horror blog discusses a fascinating problem in software development. Doers and talkers. Designers and coders.

I believe all developers need to have a bit of both in their toolbox. Mainly, because the first design is most always changed due to scope creep (failure to see all the pieces to the puzzle). If you spend all your time talking about that first design...you never get to coding. And if you can't get to the coding...you'll fail to find those missing puzzle pieces. And fail to deliver a prototype for the customers to evaluate.

Designers, this means getting your hands dirty in order to create something to improve. Developing systems is an iterative process. Design, code, design, code. And yes, even code, design, code, design. The ultimate goal is to refine the process until you and your customers are satisfied. Whatever it takes. And yes, that means moving to the coding stage even when the optimal design has yet to reveal itself. It's really a Kaizen process. Small accomplished improvements to the initial design pays dividends to all.

Coders, this means before plunging forward hacking away at the problem...ask for feedback of your idea and possible alternatives to the problem. It's important to starting coding down the right path. One that encompasses as much information of the problem as possible. This means you'll need to bring some information to the design table yourself. Perhaps a bit of discovery coding must take place to figure out what elements are involved and possible problems or bottlenecks in your proposed solution. This also helps in keeping the design discussion focused.

So, how does this apply to investing? Well, how many investors/traders do you know that invest without a plan? Without a design? An overriding investment philosophy? Just plunge ahead into the market?

These type of investors would be well served by stepping back a bit and design their investment model. Then ask for feedback of their proposed design. It's okay to perform some discovery trading first. Determining how the market handles your ideas. But, gather what you need and then design. Then invest with the goal of continually refining your design.

What about investors/traders who are afraid of the market? Have not found an investment model that is perfect? And refuse to step a toe in the market waters until they feel 100% comfortable in their design? Problem with this thinking is knowledge requires experience. And nothing is ever 100%...especially in the market. So, create your investment manifesto and then try it out. You can't improve upon something that isn't there to improve. And you can't design a successful investment strategy if you don't have market experience.

Later trades,

MT

Saturday, December 08, 2007

Breakthrough Programming

“The reasonable man adapts himself to the world: the unreasonable one persists in trying to adapt the world to himself. Therefore all progress depends on the unreasonable man.” -- George Bernard Shaw
Scott over at the scottberkun.com blog links to an amazing paper on Managing for Breakthroughs in Productivity. The article discusses how breakthroughs occur...and don't occur. My favorite quote...
For breakthroughs to occur, people must be given a chance to do work than can not be proven: ambition and risk are necessary for breakthroughs. If individuals are not trusted to take risks, breakthroughs are unlikely.
Spot on! Programming and risk goes hand in hand. As do programming and ambition.

To be an effective programmer you must have the ambition to automate tasks...all tasks. That's your job. If you spend your time manually putting widgets together...then you're not really programming.

And in order to automate tasks...a programmer has to take risks. Cause you are programming something that has never been done by a computer before. At least that computer. And most likely, never been programmed by you before.

MT

Friday, November 30, 2007

Programming Culture

Hat tip to Howard Lindzon for sharing this post...Software Engineering Tips for Startups

Alex's tips for startups is one of the best posts I've read in a long time on building a programming culture. I realize the focus is on tech startups. But, I believe his points are applicable to all companies with programming departments.

Some of my favorite quotes...
So the first tip is to always have a strong technical co-founder. Someone who shares or invents the business along with others, but also has the technical feet on the ground. Someone who can make sure the business is mapped onto technology correctly.

Avoid hiring managers...What you need are experienced technical people who love coding. These are going to be natural mentors for your younger engineers. Mentors and not managers.

Coding becomes sculpting. Starting with a shapeless form you continuously refine the code to satisfy the business requirements and make sure that the system is designed and implemented correctly.
And probably my favorite in regard to hiring programmers...
...candidates need to demonstrate love for simple and elegant code.
Simple and elegant code = Simple and elegant company.

I would also like to add one more trait to look for in programmers. Willingness to share knowledge. Evidence of this sharing trait in the interview and in past performance.

For example, all programmers develop tools to make their jobs easier. But, do they develop those tools for themselves only? Or for others to use as well? We all know...developing anything for others to use is the harder path to follow. But, without knowledge transfer, the wheel will be re-invented...again, again, and again.

Have a great weekend,

MT

Wednesday, November 28, 2007

Quote of the Week - 11/28/2007

"The Things to do are: the things that need doing, that you see need to be done, and that no one else seems to see need to be done. Then you will conceive your own way of doing that which needs to be done — that no one else has told you to do or how to do it. This will bring out the real you that often gets buried inside a character that has acquired a superficial array of behaviors induced or imposed by others on the individual." -- Bucky Fuller
Great quote. What do you see that needs to be done? And more importantly...what are you doing about it? But, a precaution...doing what needs to be done that hasn't been done by others prompts others to stall/halt the doing. Do you have what it takes to overcome the others in order to get the doing done?

MT

Saturday, November 10, 2007

Quote of the Week - 11/10/2007

"Any intelligent fool can make things bigger, more complex, and more violent. It takes a touch of genius -- and a lot of courage -- to move in the opposite direction." -- Albert Einstein
Something to think about when developing systems.

MT

Sunday, October 21, 2007

Backtesting Issues

I'm in the process of validating some investment ideas and thought I'd share some of the hidden biases that occur when comparing systems against each other and the market in general. I should know...these issues have bit me numerous times over my past 7 years of system testing. Maybe the testing methods below will help you as they have helped me.

Failure to Trade All Signals

  • Every signal received from your idea should be tested. Which means taking trades for a stock you already own. If your idea is to buy 20-day highs and you receive your first signal for YHOO on 10/15/2007...you buy it. If you receive another signal on 10/16/2007 for YHOO...guess what? You buy it. Despite already owning the stock. Failure to do so means your filtering the idea. This is okay if you already know the idea is valid...but if so...then why are you testing in the first place?
  • A big obstacle in taking all signals is money. First test the idea without money constraints. Money should not limit your trades. In fact, when testing...the only limit on your trades should be the idea.

Failure to Test the Other Side

  • So, if the idea is selecting 20-day highs...the reverse of that idea is selecting stocks less than or equal to their 20-day highs. But, performing this test presents a problem. There are fewer stocks at their 20-day highs (idea #1) than stocks not at their 20-day highs (idea #2).
  • It's unfair to compare 150 trades from idea #1 against 5,000 trades from idea #2. Whose to say randomly selecting 150 trades from the 5,000 trades in the idea #2 sample set wouldn't generate as good if not better results than idea #1?
  • And that's just how to solve the problem...boot-strap it. Take those 5,000 trades and randomly select 150 trades. Compare those results against idea #1's sample set of 150. Of course, it wouldn't be wise to select one 150-set sample from 5,000. Take several 150-set samples...compile the results and use that for the comparison.

Remove the Best Trades

  • With any system...the Pareto Principle is large and in charge. You'll find only 5% to 10% of the trades generate the majority of the idea's profits. What are the chances you would have missed a few of those trades? Throw money limits into the mix and real world events like vacations and that home remodeling project your wife has been bugging you about...and it's very easy to do. So, remove them from the test sample. Don't let a few trades in the sample play such a large role in the results.

Market Exposure
  • When buying presents for your kids...the number one rule is every kid must receive the same number of presents. If you fail here...you will pay. Testing and comparing ideas are a lot like your kids. Give them equal time and exposure.
  • Use the same signal starting point for the comparisons. If your testing date range is 01/01/1995 - 12/31/2004 and idea #1 kicks off it's first signal on 05/01/1995 and idea #2 kicks off it's first signal on 02/01/1996...no fair! Idea #1 received a 9 months head start on idea #2. Might not seem like much...but with markets and babies...9 months can make a difference.
  • In fact, it usually pays to bucket the trades in similar timeframes. That way you can ensure not only the trades share similar signal start times but also similar bucket sizes. For example, to test 10 years of data...01/01/1995 - 12/31/2004:
Bucket 1 -> 01/01/1995 - 12/31/1996
Bucket 2 -> 01/01/1997 - 12/31/1998
Bucket 3 -> 01/01/1999 - 12/31/2000
Bucket 4 -> 01/01/2001 - 12/31/2002
Bucket 5 -> 01/01/2003 - 12/31/2004
  • The buckets 1 - 5 above would be the testing date ranges. After the simulations are complete for each idea and corresponding bucket...verify idea #1's bucket 1 contains roughly the same number of trades as idea #2's bucket 1. If not, then boot-strap the larger bucket size down to the smaller bucket's size. Compare results. And remember, remove the top 5% or so trades from each idea's buckets.
[Clarification: The testing date ranges in the buckets listed above are not the start and end dates for your trades. The date ranges are the start and end dates for your idea. Meaning...all ideas triggered from 01/01/1999 to 12/31/2000 would be in Bucket 3. You would need to track those signals for as long as you stay in them...which may mean all the way to your end date of 12/31/2004. Make sense?

In essence, your overall begin and end dates are 01/01/1995 - 12/31/2004. Then you slice and dice the signals that occurred during that time frame based on entry date into buckets 1 - 5.]

Questions?
  • What if the idea consists of several smaller ideas such as selecting stocks at their 20-day high and on that new high experience a 30-day volume surge? In this case, you would need to iterate through the above process twice.
  • In the first pass, you'd compare the 20-day high stocks against stocks not at their 20-day high. In the second pass (if the first pass proves fruitful), compare the 20-day high stocks with 30-day volume surges against 20-day high stocks without 30-day volume surges.

As you can see, getting an idea through the validation process is quite an ordeal. Unfortunately for us system traders; very few ideas make it out alive. Thankfully, we don't have to cut those ideas from our sample set.

Later Trades,

MT

Wednesday, October 10, 2007

Quote of the Week - 10/10/2007

"...the most important quality for a trader to develop is discipline. As you've read, my stubborn ego and impatience prevented me from achieving lasting success and financial security. I hope my story has shown you that any fool can get lucky and quickly make a great deal of money. But, if playing the stock market was always that easy, there would be no need for research and hard work. Considering that all the information you need to be able to profit is available on the Internet, what sets successful traders apart is their ability to wade through all the muck. With regard to your sources, keep an open mind. As my losses demonstrate, if you allow your emotions and ego to control your trading, you are doomed to fail." -- Timothy Sykes from his book, An American Hedge Fund
What great words of advice! Reading Tim's book brought back the memories of what it was like trading in the greatest stock bubble of our time. In fact, I participated in the ISCO trade he mentions in the book. What a ride, indeed!

I look back and realize just how far I've come as a trader and how much further I still have to go. Tim is right...cutting through the muck is a tough chore for any trader/investor. The key to long-lasting success is keeping an open mind, learning from your failures, and working hard...really really hard. Of course, a sprinkle or two of luck never hurts.

Thanks for the book, Tim.

Later Trades,

MT

Friday, September 21, 2007

Recent Links for 09/21/2007

Newbie - converting csv files to arrays in NumPy
Great message thread on how to convert csv files to numpy arrays.
Cookbook/InputOutput - Numpy and Scipy
File processing examples using numpy, scipy, and matplotlib. How to read/write a numpy array from/to ascii/binary files.
Numpy Example List
Examples of Numpy functions such as fromfile(), hsplit(), recarray(), shuffle(), sort(), split(), sqrt(), std(), tofile(), unique(), var(), vsplit(), where(), zeros(), empty(), and many more.
Introducing Plists: An Erlang module for doing list operations in parallel
Could you spawn a trading system process for each stock of a given day's trading (a list)? What if you had 20,000 stocks for a given day? Can plists/erlang handle 20,000 processes without hitting memory constraints?

Wednesday, September 19, 2007

Recent Links for 09/19/2007

130/30 Strategy Backtested
Disagree with comparison of 130/30 to non-leveraged benchmark/strategy. Also, the additional longs didn't improve the long portion of the 130/30 returns compared to the long-only strategy returns. Am I missing something?

Monday, September 17, 2007

Recent Links for 09/17/2007

Sunday, September 16, 2007

Recent Links 09/17/2007

Goldblog - Investment Advice

    • Excellent investment advice.  Keep it simple...

      • There are 2 simple questions you must first answer:

        1. What is the time-frame in which you need access to your money? (next week? next year? 10 years? retirement?)

        2. How much risk and volatility are you comfortable with?


      • The Answer:
        Asset Allocation... not fundamental analysis, not technical analysis, not market
        trending, not tips from brokers and analysts ... but straight up asset
        allocation.


     - post by taylortree

Recent Links for 09/15/2007

Links for 2007-09-15 [del.icio.us]

Posted: 16 Sep 2007 12:00 AM CDT

Thursday, September 06, 2007

Recent Links 09/06/2007

Quantmod - Quantitative Financial Modelling Framework for R

    • Offers R language modules to...
      • calculate periodic returns
      • retrieve historic quotes from Yahoo, Google, FRED
      • there's even a tradeModel that looks interesting
      • and well documented.

    - post by taylortree

Wednesday, September 05, 2007

Recent Links 09/05/2007

Speed up R, Python, and MATLAB - Going Parallel

Tuesday, September 04, 2007

Recent Links 09/04/2007

World Beta - Engineering Targeted Returns and Risk: More On The Endowment Style Of Investing  Annotated

    • World Beta shares some links covering the endowment investing side of things...
      • A link to
        Frontier Capital Management
        - check out their knowledge section for more great papers similar to the ones Faber links to.
      • Faber mentions a great upcoming book covering the twelve top endowment CIO's .
      • from Alpha Magazine...Highbridge Capital Managment shares its office organization - putting traders and developers together.  I've always thought this would be a great idea in any shop.  By putting users and developers together - manual taks can be seen and automation can happen.

     - post by taylortree

SourceForge.net: tkdiff

  • Great little file compare utility.  Graphic front end to the diff program.
    note:  tested this today against a large file/program (well, not that large in my line of work...but I guess to Google's)...couldn't handle it.  But, works great on small files.
     - post by taylortree

Google Mondrian: web-based code review and storage

  • Online code review that works like a blog/wiki.  I wonder...is it possible to create a code review system similar to Mondrian within a source management toolset such as subversion?  Seems like most of the backend is there already...would only need to add some front end tools to display the changes being committed and allow comments on those changes.
     - post by taylortree

Monday, September 03, 2007

Recent Links 09/03/2007

ONLamp.com -- Numerical Python Basics

Programming in R

Finding Duplicate Elements in an Array :: Phil! Gregory  Annotated

Now, suppose that the array is of length n and only contains positive
integers less than n. We can be sure (by the pigeonhole principle)
that there is at least one duplicate.
    So, how do we find the beginning of the cycle? The easiest approach is to
    use Floyd's cycle-finding algorithm. It works roughly like this:
    Start at the beginning of the sequence. Keep track of two values (call
    them ai and aj). At
    each step of the algorithm, move ai one step
    along the sequence, but move aj two steps. Stop
    when ai = aj.

      Wednesday, August 15, 2007

      Investor or Gambler?

      Tom from InvestorGuide.com sent me an article of his to read regarding the differences between investing and gambling. Tom did a great job in discussing the two terms fairly. Very hard to write an article like that without exposing unknown biases.

      I did find a couple of very minor areas where I disagreed with Tom's article. I shared those comments to Tom in an email. But, felt those comments would be helpful to readers of this site. First read Tom's article. Then my comments below...
      Tom's article:
      There's a big difference between buying a stock after thoroughly researching it and buying a stock by hitting it on a dartboard.
      My comments:
      Is there really a big difference...in outcome? Sure, the person may feel different about the investment...but based on outcome alone...historical evidence would suggest the odds of success are approximately the same.

      Tom's Article:
      Gambling - "Any activity in which money is put at risk for the purpose of making a profit, and which is characterized by some or most of the following...no net economic effect results."
      My comments:
      I would argue that each player in the stock market provides a positive economic effect. The investor provides long-term capital to companies in need of capital. The speculator and gambler provide liquidity. Sure there are negative effects from all players...investors prop up some companies that probably shouldn't receive further funding...and will eventually go bust. And speculators/gamblers can turn liquidity into a frothing market that can cause long-term problems after the swell has subsided.

      Of course, your point is true that gamblers' short-term trades may be a net effect with each other...but that activity regardless of reason or length of hold...still provides liquidity for other players in the market.

      Basically, remove any player from the game...and the market wouldn't be what it is.
      That's it from here where I've got a softball game to prepare for this week. I haven't played softball since my college days. And haven't thrown many balls since my shoulder surgery. Should be an interesting show to say the least.

      Later Trades,

      MT

      Saturday, June 09, 2007

      Weekend Readings - Search for Alpha

      Sharing some great links found this morning while enjoying a Starbucks coffee and Krispy Kreme doughnut. :-)

      A great Quantitative Primer from the Bionic Turtle.

      Nice little profile on Parametric Portfolio Associates by Bloomberg Markets Magazine. I enjoyed reading their rebalancing alpha along with their contrarian weighting of individual stocks for each country. In fact, check out Parametric's Research & Whitepapers area...great information to be had. Their paper on Using Statistical Process Control to Monitor Active Managers is one to read a few times this weekend.

      One view shared by Parametric coincides with my recent testing of alpha filtering in the U.S. Equities market. Parametric found that smaller countries exhibit less correlation to the broader markets. My guess is due to less investor attention, liquidity issues, and such. In essence the markets are less efficient which enable Parametric to extract alpha (non-commoditized beta) by overweighting these smaller countries in their portfolio compared to the index they track. I found that by increasing the frequency in my alpha calculations...the fewer stocks I found that could beat the market (high alpha). Increasing the frequency to daily in my alpha filter picked up only the most illiquid stocks in the market out of the 20,000 stocks in my database (including the delisted). What does this mean? These stocks are the less followed? Less efficient? Their returns are least effected by the broad market? Short-term...all other stocks are governed by the overall market returns? Only if you extend your time horizon do stocks capture more alpha from the market? My recent testing shows this to be a possibility.

      So, what should an investor/trader do? Well, if you're a daytrader, you should pay much more attention to the market in general. The market acts as a powerful force in a stock's short-term returns. If you're an investor...extending your time horizon months if not years is a way to capture more (alpha) than the market gives (beta) to each individual stock. Think about it...anywhere the market is efficient...the market governs the behavior. Only when you drive outside of that efficient zone do you capture non-market behavior. Holding stocks for the very long-term is one road outside of the city.

      World Beta finds an interview with Harvard's Endowment manager,El-Erian. El-Erian claims his biggest challenge is overcoming the popularity of the endowment model. Which I tend to agree.

      Finally, for you R fans out there...check out the Econometric tools for performance and risk analysis created by Brian G. Peterson and Peter Carl. Need to calculate the Information Ratio, Sharpe Ratio, Sortino Ratio, max drawdowns, rolling returns, CAPM, Kelly Ratio, and Omega on your portfolio's returns? Then this PerformanceAnalytics package could be just the ticket. I have yet to work with this feature-rich package...but have it on my list of to-do's over the coming weeks.

      That's it from TaylorTree...where the weather is beautiful, coffee is great, and I've got an afternoon of fishing in my future.

      Later Trades,

      MT

      Monday, May 28, 2007

      Manager Focus - Robert B. Gillam

      I recently read an interview with McKinley Capital Management founder, Robert B. Gillam. Very interesting guy and investment style. Mr. Gillam setup shop in Alaska of all places. Despite the remote location...he runs a heavy "quant" shop. His work on ranking of stocks based on performance and risk (OR Index) bears further study from yours truly.

      What drew me to Mr. Gillam's interview was his research on stocks making new highs and new lows. Mr. Gillam found stocks making new highs on any given day to have a greater than 70% chance of hitting another new high in the next 90 days. And stocks making new lows to have a greater than 65% chance of making another new low in 90 days. Then goes into the how and why of his research. Great stuff!

      Check out these articles for further information on Mr. Gillam...
      Background on Robert Gillam and McKinley Capital Management.

      U.S. Blinders Hinder Stock Pickers. This is a great article covering Mr. Gillam's expansion into international investing.
      Here's an article from Mr. Gillam's son, Robert A. Gillam...
      STUDY CHALLENGES CONVENTION: Growth, value style distinctions also important in international investing from Pensions & Investments.
      This breakup between styles reminds me of an interview with DFA's founder, Rex Sinquefield. Mr. Sinquefield discussed how value stocks were riskier than growth stocks despite their similar volatility. Thus the reason for value stock's higher returns over the years.
      Have a great week!

      MT

      Sunday, May 20, 2007

      Weekend Linkfest!

      The Beta in Alpha's clothing? (pdf) Bridgewater Associates' detail how various hedge fund's are charging Alpha prices for Beta returns.

      How to differentiate Alpha from Beta in those hedge funds? Check out AllAboutAlpha's post titled, Mommy, Where do alphas come from? AllAboutAlpha does a great job of summarizing Andrew Lo's paper, Where Do Alphas Come from?: A New Measure of the Value of Active Investment Management. Lo explains how to differentiate active returns from passive and more importantly what value the active returns add to the total returns of the portfolio. Cool stuff!

      Very interesting draft, When Do Stop-Loss Rules Stop Losses?, by Kathryn M. Kaminski and Andrew W. Lo. They find stop-losses improve returns and reduce volatility compared to buy & hold. And stop-out periods were distributed uniformly over time versus only during small market crashes.

      MOSERS discusses how to handle residual cash in a portfolio in the following newsletters, Rebalancing and Cash Securitization and Rebalancing II. I was shocked to discover how big of an impact residual cash had on my returns during my market studies. A cash drag indeed! Very important to get that cash, no matter how small, back into the market in order to generate further market returns.

      Enjoy your week!

      MT

      Tuesday, May 01, 2007

      Quote of the Week - Busy Bee

      "I really believe that success is just getting up one more time than you fall. It doesn't come from one brilliant idea, but from a bunch of small decisions that accumulate over the years. And you shouldn't underestimate the amount of work that's involved, the amount of fear that's involved." -- Roxanne Quimby
      I love unconventional success stories. And Inc.com shares a great one with Burt's Bees founder, Roxanne Quimby.

      Enjoy Quimby's story? Here are a few more interviews with the busy bee...
      After Burt's Bees, What? from Business Week

      Interview with Burt's Bees founder, Roxanne Quimby from Hilary Magazine.

      MT

      Saturday, April 28, 2007

      Sky is Falling...

      According to this article, Jeremy Grantham believes the sky is falling.
      "The bursting of this bubble will be across all countries and all assets, with the probable exception of high-grade bonds," Grantham warned. "Since no similar global event has occurred before, the stresses to the system are likely to be unexpected. All of this is likely to depress confidence and lower economic activity."
      But, plenty of hedging is done as to the timing of the fall.
      As for timing, he (Grantham) concedes that's impossible to predict. But here's the kicker: Even Grantham thinks you probably need to be bullish right now. The reason? Most bubbles, he notes, go through a short but dramatic "exponential phase" just before they burst. Like Japan in 1989 or the Internet in early 2000.
      How does this type of prognostication help anyone...I asks ya's?

      Grantham's bold statements and subsequent hedging of bets is something a lot of market pundits do. This allows them to zig and zag at the same time. If the market goes down big, Grantham claim's victory. If the market goes up big, Grantham claim's victory. A win-win scenario.

      This type of hedge may prove useful in other pursuits. For example, wouldn't it be nice to lead a programming project and hedge the timeline of the project?
      Yes, we will make the May 1st deadline unless we don't.
      The above statement doesn't work because it's not wordy enough. Too simple...straight to the point.
      We fully expect to meet the May 1st deadline. All components have been reviewed, tested, and verified to meet our stringent requirements. But, there is always the case that problems may arise due to circumstances outside our control. These problems may impact our schedule and possibly result in extending the deadline.
      There, that's better. A great hedge!

      Well, that's it for me this Saturday morning. I'm taking my daughter fishing today. Of course, the fishing trip may be delayed or cancelled if changes in the Earth's atmosphere produce drops of water from the sky. ;-)

      Later Trades,

      MT

      Monday, April 23, 2007

      Quote of the Week

      "If you spend some time thinking about it ("ideal position sizing") you will realize that life just isn’t so simple. Every individual has different tolerances for different types of risks. A formula won’t capture all of them and a formula most certainly hides information that might be very valuable." -- Curtis Faith
      Great article posted by Curtis today . Discusses some of what I found to be true in regards to the Sharpe Ratio and smoothness of returns. In fact, through much testing I have found using any type of volatility measure in my trading systems (entry, exit, position sizing, etc.) produces sub-par results when real-world results take effect. But, sometimes, those are the best measures we have. So, what do you do?

      I think it's important to do what Curtis asks...
      I’ll leave you with an exercise. Take your favorite position sizing methodology and then see what might happen if you happened to take the wrong side of a trade using that methodology on September 11th, 2001 or on Black Monday (October 19th, 1987).
      In regard to formulas hiding valuable information. Pay attention to your stock data. There's a formula in there adjusting your time series for splits and possibly dividends. The longer term your system is...the more important this adjustment formula will play in your overall results. Common entry/exits formulas such as Average True Range (ATR) become rather out-of-date when processing IBM back in the 1960's. Something for all aspiring long-term trend-followers to consider when backtesting their systems.

      Enjoy your week! I'm enjoying my first day of vacation since moving up to Missouri. And what a pretty day I picked out. What to do...what to do... ;-)

      Later Trades,

      MT