Showing posts with label investing. Show all posts

Friday, January 01, 2010

David Swenson Lecture

So long 2009, Hello 2010!

Let's start the new year right with a great video refresher on long term investing by Yale Endowment hall of famer, David Swenson. It's long but well worth the view. And be sure to watch the Q&A at the end. Some highlights from the lecture:

Swenson covered 3 areas in relation to portfolio returns:
  1. Asset Allocation
  2. Market Timing
  3. Security Selection

Swenson believes Market Timing and Security Selection are actually a negative drag on returns. And Asset Allocation produce over 100% of the returns. Does a nice job explaining this.

Also covers how survivorship & backfill bias makes things seem better than they really are. I was really surprised at some of the numbers he shared on this topic. Based on Swenson's study...I would have thought survivorship bias would impact my long-term trading system's results more than they have.

The best tidbit mentioned in the video was Swenson's coverage of the differences 1st quartile managers generate versus 3rd quartile. In the bond market he found very little difference between the best managers returns and those in the 3rd quartile. But, as he drove down into the more inefficient markets...the differences between the best and the rest grew further apart. Swenson's take: spend time and energy persuing the most inefficiently priced asset classes cause great rewards in finding the top managers.

The final item I took away was from the Q&A session at the end. Swenson worries about the top down but invests from the bottom up. Identifies asset classes that are overpriced or underpriced. Extends his time horizon out 3 or 4 years. Bets big while keeping his asset allocation to the asset class at an annually reviewed level.

Well, that's it from the cold midwest where I plan to spend the first day of the new year: taking the kids to get doughnuts in the morning, hopefully watching snow fall during the day, and enjoying some great fajitas and cervezas for dinner.

Happy New Year,

MT

Saturday, August 08, 2009

Portfolio Performance for July 2009

Another month in the green. Let's hope we can keep the momentum going for the portfolio. Still getting trounced by the market, but hopefully I'll start catching up now that 100% of the portfolio is invested.


On to system development news...
I'm deep in the heart of testing all the changes made to the backtesting engine. Most of the simulation output was converted from plain text (csv) files to sqlite tables. This option will broaden the front-end options available to the platform. Testing should wrap up by the end of August. Then I can start sharing some of the results on this blog.

Later Trades,

MT

Monday, July 27, 2009

Portfolio Performance for June 2009

June was a great month, both personally and for the portfolio. My family and I headed off to Texas for a few weeks to spend time with family and escape to the hill country for some good old R&R.

It was great visiting with everyone, checking out the beautiful Texas scenery, and enjoying some great food. There's a place in Liberty called Jax that served great catfish and an equally great ambiance. The restaurant is just across the street from the courthouse...so the place is the true heartbeat of the town. Could have been a setting out of a John Grisham novel. Very cool.

The picture taken to above was a rainbow we caught on our way back from dinner just before sunset. Felt it was appropriate considering the portfolio beat the market for the first month since February.


Not obvious in the above chart, but the S&P 500 returned only 0.02% for the month of June. And the portfolio returned 1.58%. Not much to brag about but nice to breathe some air for a month.


For the month of June, the portfolio is approximately 21% in cash which is quickly dropping due to the high number of signals received in the month of July.

As far as the portfolio simulation engine...I've had some exciting progress this past month.It really helped getting some quiet time. Each morning, I would get my coffee, sit out on the front porch, watch the hummingbirds go to war, the doves get lovey, and hack away on the simulation engine. I've created a new database that utilizes the Python's struct module for binary storage, SQLite for storing pointers to the records, and Numpy for field named record access. The best part is the database requires very little memory, has a small disk footprint, and is faster than anything I've worked with before. Previously, using a database of any kind was not an option. The aha moment was in realizing the bottleneck in performance was due to the number of records stored not the size of the records. Therefore, my main goal was to reduce the number of rows in the table and scale horizontally in the table versus vertically. This drastically reduced the lookup time.

Now, I'm in the process of refining the reporting engine and building a price series plotting framework with Matplotlib and Numpy. So, far the results look very promising. Nice to finally get some pretty charts to the simulation engine instead of a clunky MS Excel interface. Still more work ahead.

Heck, I've made so much progress sitting out watching those birds in the morning that I came home and started on a flower garden in our backyard. I've just finished tilling up the dirt and planting a few plants. We've already got hummingbirds fighting and a squirrel trying to figure out how to open that bird feeder. Now, I just need to get to hacking!

Later Trades,

MT

Tuesday, June 30, 2009

Portfolio Performance for May 2009

April and May flew by. Been in hacker mode for a few months now working on the simulation platform. I get that way sometimes. There are times when my multi-tasking capabilities better superman. And then there are times like now where I have a laser sharp focus on one thing and one thing only. I think this focus kicks in at times when I can't wrap my mind around a problem. When that happens...I dig in, research, analyze, test, and don't stop until the problem is solved. It is tiring...but allows some pretty tough problems to be resolved.

The main crux of my problem is building a platform that is very flexible but highly efficient. If I was developing a platform that tested less than 2 gig of data...I'd be home free. But, get past the 2 gig barrier and all kinds of these wonderful flexible designs and databases everyone uses as default must be thrown out the window. Can't use a database in the traditional sense for your time series. Not if you want your simulation to finish in under an hour.

The simplest approach is to use flat text files as I've mentioned in the blog before. But, as you ramp up the dynamic nature of your simulation testing...you need a way to index those files. And the kicker is even the index cannot fit into memory. So, you wrestle with the memory barrier and disk io. Even creating binary files in order to reduce the size of your files. But, binary files limit your flexibility. I'm still testing and refining the solution...but slowly getting there. Basically taking a process that used to run 45 minutes long and dropped it down to less than 10 minutes. With the added ability to randomly seek to any date or symbol in the 20,000 symbol database quicker than you can say Jack Robinson.

Oh well, moving on. It's way past portfolio performance time...so better late than never...the portfolio performance as of May 2009:


As you can see...I'm still getting trounced by the market. Largely, because I'm still 50% in cash and the system normally doesn't perform well during these sharp bouncing bottoms the market has recently experienced. That's the one thing that has been difficult the past few weeks with all the recent buy signals. Many of the signals are from stocks that have already surged greater than 50% to 100% in just one month. Even though my position size is very small per stock...it is still at times tough to buy such a strong performing stock.

And that's it from here where I'm looking forward to the 4th of July, a few cold ones, and time with family.

Finally, my sister-in-law turned the big 40 today. Happy Birthday!

Later Trades,

MT

Sunday, April 26, 2009

Portfolio Performance for March 2009

Better late than never on the portfolio stats for March. I've been traveling a bit and wrapping up projects which caused the delay. And more importantly, continued development on the simulation engine.

A brief look at the charts below details my fear...the market surged upward with 100% of its money in the stock market. Me? My portfolio is over 50% in cash...therefore cash lag is kicking in for March. And my portfolio will suffer until that situation rectifies...ala more buy signals.


May is gearing up for another busy month for yours truly. Plus, it will soon be summer vacation time. We're researching cabin rentals on the waterfront. Two summers ago we spent a day swimming at Table Rock Lake and had a blast. Looking to expand on that this summer. But, doesn't have to be Table Rock. If anyone has any recommends...send my way.

And that's it from Mid-Mo, where garden stores are packed full of anxious gardeners trying to make the most out of the first dry, sunny, and warm weekend in months.

Later Trades,

MT

Sunday, March 08, 2009

Portfolio Performance for February 2009

February produced another all-time max drawdown in the portfolio. During times like this...logic rains down...am I doing something wrong? How much more money will I lose to the market?


Another common logic trap is should I second guess my system? Should I take the next trade? A few weeks ago...I received several new signals...and I took every one of them only to see several of them hit their exit signals last week.


You want to change your rules...filter out times like these...so difficult to watch your money be eaten away by the current market forces.


But, that is why you test your ideas so fully...both in good times and bad. So, you can continue to follow your system despite all the others washing away in this storm.

I'm sure there will be more weeks if not months that I buy stocks only to sell them weeks later. As bad as it sounds to yours truly, more months of drawdown. But, I have accepted this fate. I have accepted these circumstances because I have tested every ounce of my ideas in every market I can imagine...and I agreed to the results.

And when the storm is over...and everyone is afraid to buy stocks...my system will continue to generate signals of stocks to buy. And I will buy them. And follow the market wherever it leads despite how difficult that may be.

Later Trades,

MT

Monday, February 02, 2009

Portfolio Performance for January 2009

The new year started out with a bang, that's for sure. We're hitting new all-time max drawdowns in the system...2001/2002 were the last time these levels were seen for yours truly.


You can see below that we're beginning to lose money again...though not as bad as the market. The reason for this is because I've received several new signals the past few weeks which have creeped up the percent invested in the portfolio. Still nowhere near fully invested levels...but at least getting the barrel loaded in case the market takes a turn for the better.


The chart below details max drawdown levels for the portfolio and the market. Not sure how much help this is in evaluating the portfolio against the market. Especially when the main difference between the market's drawdown versus TaylorTree is the capital invested. It is as simple as that.


Now, on to some good news. The trading platform is beginning to shape up nicely. For the first time in several years of trading I have the maintenance of the portfolio completely automated. No, that doesn't mean orders are automatically placed with my broker. What it does mean is my portfolio is now completely monitored for sell signals, additional buy signals, stale positions, etc. Might not sound like much...but you'd be surprised at how much manual effort there is in trading a system - from managing the data sources to ensuring all positions are accounted for each and every night.

The next step and one I'm not especially looking forward to is creating several test cases for the money overlay of the backtesting platform. Things can get complicated very quickly in this area. And I want to make sure I've captured all the requirements of the platform before I begin coding. This is the area where I always get stuck due to the requirement of handling multiple trading systems, leverage, and various cash options in real-time. Also, I want the ability to dump unused cash directly to the market. Very interested in how the portfolio will handle being in the market 100% of the time when the trading systems are not utilizing 100% of the capital.

Later Trades,

MT

Wednesday, January 14, 2009

Portfolio Performance for December 2008

Hope everyone enjoyed the holidays and the new year is treating you right.


I'm afraid the portfolio nor the market changed much in December. Like watching paint dry. Oh, I'm sure there's quite a few market prognosticators out there shaking the tea leaves. Looking back on what they did right for the year and what they expect for the new one. I guess, I should do the same...

What I did right for 2008?
  • Traded the system without question.
  • Eliminated all market news and views from my trading turret.
  • Completed the rebuild of the backtesting platform's foundation.
  • Incorporated portfolio tracking in the platform.

What to expect for 2009?
  • Add a charting component to the platform.
  • Generate better performance reports from simulations.
  • Code and compare the internal file system in numpy, sqlite, berkeley db, and plain old csv files (which it is currently).
  • Simplify the scanning component and explore multi-core options.
  • Replace the aging windows box with a fresh linux version.
  • Enable portfolio allocations at the trading system level. This way can test effects of combining systems and determine optimal allocation levels.
  • Create a nice front-end for the platform.
On a personal note, my family is exploring the possibility of adding a dog to the household. The last dog in our family passed away about 1.5 years ago. She was a lab-heeler mix that we saved from the local pound as a pup. Great, great dog. My daughter's best friend...and mine. Feel enough time has passed and exploring a few of the gundog breeds. In particular, the French Brittany. If anyone has experience in this breed or know of a good breeder...leave a comment.

Later Trades,

MT

Tuesday, November 11, 2008

Portfolio Performance for October 2008

Drawdown city. Stay in this game long enough and you'll encounter months like September/October. In fact, they happen so infrequently...it's almost like recalling a memorable storm from years back. I still remember the panic my mom went into whenever there was a hurricane in the Gulf. She'd stock up on food, plot the hurricane on those maps the National Hurricane Center would give out, and fret, fret, fret. 99% of those hurricanes would peter out, stall, or miss us entirely. But, she still remembered living through the devastation of Hurricane Carla...and felt the fear every summer 30+ years later.

The human mind is a funny, funny thing...behaving binary with pain. If you've never experienced the pain of a hurricane, snowstorm, loss of a loved one, or the falling knife of the market...you're set to 0. You operate without fear. But, once you experience the pain...you're set to 1. And everything you do from that point forward is now based off that pain. Based off that switch.

And that switch is a bugger to reset. Most people can't do it. The instant the pain hits they begin tweaking their life as if the odds of experiencing that pain again has increased to a 100% certainty. Funny part is...
  • the odds of experiencing the pain hasn't increased
  • all those tweaks won't do a thing to prevent future pain.
Smart people get stuck in this trap...a lot!

What's my point? Invest in the market knowing the worst will happen. The foundation of your investment strategy should be able to withstand the storm. If you're busy tweaking your strategy right now in an attempt to avoid the next storm, trying to pick and choose your investment spots, thinking all the work you're doing will sidestep the next storm because you figured out how to handle this storm...then your bit is set to 1. And this cowboy quote likely fits:

Timing has a lot to do with the outcome of a rain dance.
And with that the performance charts for the month of October 2008.


We're experiencing a fairly hefty drawdown as is the market. I've received several exit signals over the past 2 months. At one of the highest level of cash since investing in the market. And doing nothing but patiently waiting out the storm.

That, and preparing for a cold Missouri winter.

Later Trades,

MT

Sunday, October 12, 2008

Portfolio Performance for September 2008

September came and went. October brought the perfect storm...I guess. Looking forward to October's portfolio performance in relation to the market...to see how bad things really are. Until then...let's cover September's performance.

September's VAMI


September's ROI


As you can see, not a great month of performance. And while the downside doesn't feel good...my greatest concern is the upside that will come. When it does...the portfolio will lag the market due to the relatively high level of cash. But, nothing we can do...but be patient and allow the system to do its job.

Last thing you want to do during turbulent times is hit the panic button. Or worse, try to figure this market out. You don't figure a hurricane out while you're in the middle of it. Don't buy a generator, food, and flood insurance during a hurricane. Those are things you buy prior. The only thing you can do when the storm hits is batten down the hatches and hope you prepared enough for the damage to come. After the storm is over...reassess what you did right and what was lacking. Oh, and clear those fallen trees from your portfolio.

On a side note...I've spent the weekend putting together a new office. I've bought several office pieces and trying to find the optimal setup. Once I've got everything moved in...I'll share some pics of the new digs.

Later trades,

MT

Tuesday, October 07, 2008

What I'm Researching...


The Sect of Homokaasu - The Rasterbator

Posted: 07 Oct 2008 01:45 AM CDT

Cool, print huge posters from normal paper - software breaks up images to fit on 8.5 x 11 paper. Hat-tip to my wife for finding this site.

PerTrac Support - Statistics

Posted: 06 Oct 2008 12:43 PM CDT

Great site covering formulas of investment stats. Useful for coding the performance part of the testing platform.

pickle(cPickle) vs numpy tofile/fromfile - Python - Snipplr

Posted: 05 Oct 2008 11:09 PM CDT

interesting code snippet comparing performance of cpickle and numpy to/from file routines. been thinking about this lately...using numpy directly or cpickle instead of using a bloated dbms for persistent storage of time series on the testing platform.

HintsForSQLUsers - Hierarchical Datasets in Python

Posted: 05 Oct 2008 11:06 PM CDT

covers many of the faq of SQL developers when developing with PyTables.

EasyvizDocumentation - scitools - Google Code - Easyviz Documentation

Posted: 05 Oct 2008 09:55 PM CDT

Python plotting interface to various backend plotting engines: Gnuplot, Matplotlib, Grace, Veusz, PyX, VTK, VisIt, OpenDX, and a few more. Seems like a fairly straight-forward interface. And choosing the backend used is a one-line import statement. Interesting.

PyX - Python graphics package

Posted: 05 Oct 2008 12:25 PM CDT

looks like a dead-simple plotting library in python to produce pub quality pdf/ps images. Need to explore.

Thursday, September 11, 2008

Portfolio Performance for August 2008

Some very nice weather happening here in Missouri. In fact, in all my life I've never had weather like this in August/September timeframe.

Back in Texas, it's usually some of the hottest times of the year. But, feels like Fall already in Mid-Mo.

Can't wait to see the leaves turn colors. Of course, my kids are looking forward to piles of leaves to jump and play
in.

Maybe this weather change will bring the market out of the doldrums. By the way, the picture above was taken while visiting the Devil's Ice Box.

And now for the August returns...


Still, nothing going on with the market or the trading system. Though, plenty to do with the system testing platform. I'm exploring the numpy library for python to determine how big a role this library should play in the platform's architecture. For those curious...check out my delicious bookmarks on numpy.


Later Trades,

MT

Thursday, August 21, 2008

Sector Allocations for August 2008

Quick look at the sector allocations for the portfolio. Please note that cash is not included in the breakdown. Next on my development list.

MT

Saturday, August 09, 2008

Portfolio Performance for July 2008

July ended with a surgery for yours truly. I had my gallbladder removed. I had a rough few days of recovery but starting to feel normal again.

I had a set back this month in regard to the testing platform. The redesign has severely extended the simulation runtime. So, I've spent much of my time finding the bottlenecks of the code and determining the optimal solutions. Very thankful python has such great profiling tools at the ready.

You know, performance tuning code is sure a lesson in humility. All my years of programming...I feel I should have a good handle on the slow areas of my code. It only takes a profiling report to show how wrong I am.

Very similar to trading the market. Trading decisions are based on our experience. Where we think the money-making opportunities are. Only takes a simple backtest to showcase how wrong we are.


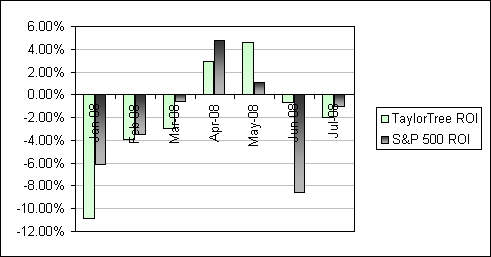
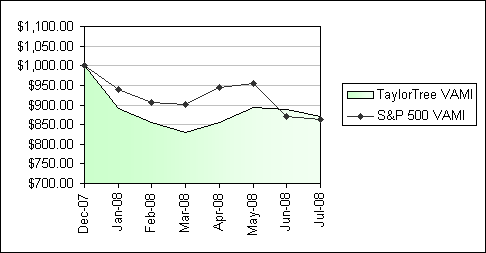
And with that...some charts for the month of July...


Not a whole lot of movement in the portfolio occurred the month of July. Just another month of sitting and waiting. Letting the system do what it does best...waiting for the market's next move.

Later trades,

MT

Tuesday, July 08, 2008

Portfolio Performance for June 2008

June was a great month for the family. My major project came to a successful close. And with that a huge amount of time freed up. With that, we made our first trip back to Texas in 2 years. It was a very nice visit. We were able to see family, play on the lake I grew up on, and enjoy some much needed Texas culture.

June wasn't as great for the portfolio. But, did manage to beat the market for the month by a fairly large margin putting us in the lead for the first time this year. I believe a big reason for this outperformance was due to the pulling of weeds back in March and April. This allowed new positions to take hold in the portfolio garden.

Goals for the month of July?
  • Complete the upgrade that will enable testing of multiple systems against a common portfolio. This will allow exploration of various allocation methods. And judge the effects of merging long-term systems (trend capturing) with short-term systems (volatility harvesting).
  • Wrap-up the upgrade that allows ranking of signals and existing positions in order to initiate trades.
  • Modify how cash is tracked in the testing platform. Currently, cash is a static variable. Goal is to convert cash into a unit series to enable dynamic pricing. This will enable sweep accounts in the portfolios. And allow the switching of cash instruments.

Later Trades,

MT

Monday, June 02, 2008

Portfolio Performance for May 2008

I've been neck deep in one heck of a massive project at work. Today is the first day in months that I've got a breath. And with that breath, I figure I'd post the portfolio's performance from the past few months.


As you can see, the past two months have been the best months of the year for the portfolio. Still not great...but much better than before. In fact, in the chart below, you can see the portfolio's monthly return finally beat the market for the first time this year.


You might have noticed a change in the charts from the prior month's reporting. That's due to a change in Icarra's chart rendering methodology. This new methodology proved more difficult to post images to this blog. So, I rolled my own portfolio software. Which is definitely a work in progress. Over time, I hope to develop the capabilities to track and share more details on trade statistics from this software.

My ultimate goal is to merge my backtesting application with this portfolio software. This way I could compare simulated results with real-time performance.

What are my next investment experiments?
  • I'm curious how the elements of permaculture can be used in selecting investment vehicles for the portfolio.
  • Would Janet Brown's investment methodology improve my system results?
  • When receiving a large number of buys for a given sector...is it better to buy as many stocks as I can under my risk limits? Or more appropriate to opt-out of all the individual stocks and buy an ETF in that sector to capture the obvious sector-based trend?
  • Measuring systems that utilize different levels of cash throughout their system life cycle. If system A's performance is better at all conventional levels (Sharpe, ROI, etc.) than system B's...yet system B uses 50% less cash...are the comparisons valid? I don't believe so...but how do you compare then? Via converting unused cash to utilize market-based returns? This is a tough one.
That's it from here where we've had so much rain in Missouri that I'm beginning to think I'm back in East Texas.

Later Trades,

MT

Tuesday, March 04, 2008

Portfolio Performance for Feb 2008

Another month in drawdown. This is where the lesser experienced would begin to question the validity of their system. Has something stopped working? Did the market change? If you design your strategy based on a helter skelter of methodologies...you may have a point.


But, if you build your system based on capturing the market's inherent behavior: stocks can exceed 100% returns but never exceed 100% loss (unless on margin). Then you know when the market turns south...you'll turn south. Nothing you can do but weather the storm. The fortunate thing is you have allocated your money based on this knowledge...that there will be storms. And you must wait for the storm to pass...the skies to clear...and the markets to return.

Below are the sector breakdowns for the portfolio. The cash level increased 35% from last month's level. Again, the increase in cash will reduce the portfolio's drawdown should the market continue to stall. But, decrease our returns should the market recover.


In fact, you can see in the chart below the difference the cash level is making to the portfolio.


February's drawdown is beginning to slowdown in comparison to the benchmark. As we move further and further into the market's downturn...the portfolio will begin to break off from the benchmark due to the rising cash level.

This rising cash level is due to 29% of the portfolio's positions hitting trailing stops since Jan 1st. In that same timeframe, our new new positions increased by 4%. Is this good or bad? Neither. Just the way the market works.

On a side note...the weather here in Missouri is toying with us. You can tell spring is trying to push it's way in...but the winter isn't giving up without a fight. Crazy thing to be riding bikes in short-sleeves one day and bracing for snow the next. Markets and weather...what fun.

Later Trades,

MT

Sunday, February 03, 2008

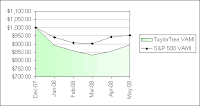
Portfolio Performance for Jan 2008

I would like to have done a better job at my first portfolio performance post. But, I'm afraid I've been extremely busy at my day job. So, please be patient. My hope for future performance posts is to include much more information about the returns and portfolio breakdown.


One of the difficult items I've found in preparing for posting of portfolio performance is the lack of good tools. I've tried quite a few products the past few months and was about to give up hope until I found Icarra. Sweet product. One of the hardest things to create is a simple product. So many developers miss the mark...the tendency is to focus on the bells and whistles. Icarra hits the mark with it's great charts, sector breakdowns, and ease of trade entry.

This is a good segway into developing a portfolio. As an investor, you have unlimited choices. Question to ask yourself...do you focus on the bells and whistles? Or do you hunker down and keep your choices simple...your strategy simple. If you find yourself changing your portfolio on every market downturn just because you feel like you should be doing something...then maybe it's time to refocus. Are you really improving your portfolio returns? Or just keeping yourself busy?

Now, back to portfolio performance. There are some things to note. I have not entered my actual entry prices into Icarra. Just too much data to sift thru in order to accomplish that. Instead, I have entered all the positions as if I bought them on the last day of 2007 (12/31/2007). From this point forward I will enter all sells, new buys, dividends, interest, etc. into Icarra. But, keep in mind...all performance is based on the clean slate of 2008.

Below is the breakdown of sectors in the portfolio. This is one area that I found some differences in the chart and the actual breakdown in Icarra. But, useful nonetheless. I'll contact Icarra to find the reason for the difference and post in the next performance release.


You can see, I now have a very large cash position in the portfolio. I don't like this, I have to admit. This will cause the portfolio to lag should the market gain back momentum. But, this is the normal process of the system. During market downturns like we've had...the trailing stops are hit and the bugs in the portfolio are killed. Then we have the waiting game for new signals. The goal, of course, is to be 100% invested in the market...that is what generates our returns. But, all seasons have their winters...and this is where we bundle up and wait for the ice to melt.

Another area I want to point out in the sector breakdown is the lack of consistency in the sector weightings. My goal is to have a better balance in the sector weightings. These sector weightings cannot always be controlled due to the nature of the system's signals. Some sectors may be very cold and other sectors can be very hot. Based on the weightings above, the services sector was pretty hot for 2007....and have held up relatively well in the portfolio during our bug killing in the recent market downturn.

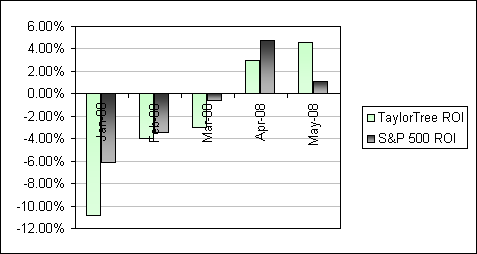
Finally, I want to review the monthly returns of the portfolio...


Pretty large differential between the portfolio's monthly returns and the S&P 500's. The system is more volatile than the market and as result drawdowns and gains are larger. This is par for the course with trend following systems in general. It takes a lot of patience to trade a trend following system. Especially, a long-term trend following system. But, I truly believe, that's where the returns are in the long-term.

Can this be improved? Possibly. There are ideas I have yet to test that could trim the portfolio's volatility. And hopefully, I'll get a chance to test these ideas in the months to come.

If you have any questions or would like to see other aspects of the portfolio...drop me a line.

Later trades,

MT

This post is for information and entertainment purposes only. Under no circumstances does this information represent a recommendation to buy or sell securities or any other type of investment instruments.
Tuesday, December 11, 2007

To Design or Code?

"The one who does the work decides." -- KDE principle
Jeff Atwood over at the Coding Horror blog discusses a fascinating problem in software development. Doers and talkers. Designers and coders.

I believe all developers need to have a bit of both in their toolbox. Mainly, because the first design is most always changed due to scope creep (failure to see all the pieces to the puzzle). If you spend all your time talking about that first design...you never get to coding. And if you can't get to the coding...you'll fail to find those missing puzzle pieces. And fail to deliver a prototype for the customers to evaluate.

Designers, this means getting your hands dirty in order to create something to improve. Developing systems is an iterative process. Design, code, design, code. And yes, even code, design, code, design. The ultimate goal is to refine the process until you and your customers are satisfied. Whatever it takes. And yes, that means moving to the coding stage even when the optimal design has yet to reveal itself. It's really a Kaizen process. Small accomplished improvements to the initial design pays dividends to all.

Coders, this means before plunging forward hacking away at the problem...ask for feedback of your idea and possible alternatives to the problem. It's important to starting coding down the right path. One that encompasses as much information of the problem as possible. This means you'll need to bring some information to the design table yourself. Perhaps a bit of discovery coding must take place to figure out what elements are involved and possible problems or bottlenecks in your proposed solution. This also helps in keeping the design discussion focused.

So, how does this apply to investing? Well, how many investors/traders do you know that invest without a plan? Without a design? An overriding investment philosophy? Just plunge ahead into the market?

These type of investors would be well served by stepping back a bit and design their investment model. Then ask for feedback of their proposed design. It's okay to perform some discovery trading first. Determining how the market handles your ideas. But, gather what you need and then design. Then invest with the goal of continually refining your design.

What about investors/traders who are afraid of the market? Have not found an investment model that is perfect? And refuse to step a toe in the market waters until they feel 100% comfortable in their design? Problem with this thinking is knowledge requires experience. And nothing is ever 100%...especially in the market. So, create your investment manifesto and then try it out. You can't improve upon something that isn't there to improve. And you can't design a successful investment strategy if you don't have market experience.

Later trades,

MT

Sunday, October 21, 2007

Backtesting Issues

I'm in the process of validating some investment ideas and thought I'd share some of the hidden biases that occur when comparing systems against each other and the market in general. I should know...these issues have bit me numerous times over my past 7 years of system testing. Maybe the testing methods below will help you as they have helped me.

Failure to Trade All Signals

  • Every signal received from your idea should be tested. Which means taking trades for a stock you already own. If your idea is to buy 20-day highs and you receive your first signal for YHOO on 10/15/2007...you buy it. If you receive another signal on 10/16/2007 for YHOO...guess what? You buy it. Despite already owning the stock. Failure to do so means your filtering the idea. This is okay if you already know the idea is valid...but if so...then why are you testing in the first place?
  • A big obstacle in taking all signals is money. First test the idea without money constraints. Money should not limit your trades. In fact, when testing...the only limit on your trades should be the idea.

Failure to Test the Other Side

  • So, if the idea is selecting 20-day highs...the reverse of that idea is selecting stocks less than or equal to their 20-day highs. But, performing this test presents a problem. There are fewer stocks at their 20-day highs (idea #1) than stocks not at their 20-day highs (idea #2).
  • It's unfair to compare 150 trades from idea #1 against 5,000 trades from idea #2. Whose to say randomly selecting 150 trades from the 5,000 trades in the idea #2 sample set wouldn't generate as good if not better results than idea #1?
  • And that's just how to solve the problem...boot-strap it. Take those 5,000 trades and randomly select 150 trades. Compare those results against idea #1's sample set of 150. Of course, it wouldn't be wise to select one 150-set sample from 5,000. Take several 150-set samples...compile the results and use that for the comparison.

Remove the Best Trades

  • With any system...the Pareto Principle is large and in charge. You'll find only 5% to 10% of the trades generate the majority of the idea's profits. What are the chances you would have missed a few of those trades? Throw money limits into the mix and real world events like vacations and that home remodeling project your wife has been bugging you about...and it's very easy to do. So, remove them from the test sample. Don't let a few trades in the sample play such a large role in the results.

Market Exposure
  • When buying presents for your kids...the number one rule is every kid must receive the same number of presents. If you fail here...you will pay. Testing and comparing ideas are a lot like your kids. Give them equal time and exposure.
  • Use the same signal starting point for the comparisons. If your testing date range is 01/01/1995 - 12/31/2004 and idea #1 kicks off it's first signal on 05/01/1995 and idea #2 kicks off it's first signal on 02/01/1996...no fair! Idea #1 received a 9 months head start on idea #2. Might not seem like much...but with markets and babies...9 months can make a difference.
  • In fact, it usually pays to bucket the trades in similar timeframes. That way you can ensure not only the trades share similar signal start times but also similar bucket sizes. For example, to test 10 years of data...01/01/1995 - 12/31/2004:
Bucket 1 -> 01/01/1995 - 12/31/1996
Bucket 2 -> 01/01/1997 - 12/31/1998
Bucket 3 -> 01/01/1999 - 12/31/2000
Bucket 4 -> 01/01/2001 - 12/31/2002
Bucket 5 -> 01/01/2003 - 12/31/2004
  • The buckets 1 - 5 above would be the testing date ranges. After the simulations are complete for each idea and corresponding bucket...verify idea #1's bucket 1 contains roughly the same number of trades as idea #2's bucket 1. If not, then boot-strap the larger bucket size down to the smaller bucket's size. Compare results. And remember, remove the top 5% or so trades from each idea's buckets.
[Clarification: The testing date ranges in the buckets listed above are not the start and end dates for your trades. The date ranges are the start and end dates for your idea. Meaning...all ideas triggered from 01/01/1999 to 12/31/2000 would be in Bucket 3. You would need to track those signals for as long as you stay in them...which may mean all the way to your end date of 12/31/2004. Make sense?

In essence, your overall begin and end dates are 01/01/1995 - 12/31/2004. Then you slice and dice the signals that occurred during that time frame based on entry date into buckets 1 - 5.]

Questions?
  • What if the idea consists of several smaller ideas such as selecting stocks at their 20-day high and on that new high experience a 30-day volume surge? In this case, you would need to iterate through the above process twice.
  • In the first pass, you'd compare the 20-day high stocks against stocks not at their 20-day high. In the second pass (if the first pass proves fruitful), compare the 20-day high stocks with 30-day volume surges against 20-day high stocks without 30-day volume surges.

As you can see, getting an idea through the validation process is quite an ordeal. Unfortunately for us system traders; very few ideas make it out alive. Thankfully, we don't have to cut those ideas from our sample set.

Later Trades,

MT