The critical ingredient is a maverick mind. Focus on trading vehicles, strategies and time horizons that suit your personality. In a nutshell, it all comes down to: Do your own thing (independence); and do the right thing (discipline). -- Gil Blake
Sunday, October 12, 2008
What's an Outsider to do?
Same goes with people. Typically, talk very little about the market to others. And rarely hear more than a peep or two about the market from others in the water cooler discussions.
That is until now. This recent market debacle has really changed things. Howard is causing me to eat mucho brussel sprouts. My wife is hearing about the market on Dr. Phil & Oprah of all things. And even my programming bloggers are discussing the economy and the hoozy whatsits of the markets.
So, what's an outsider to do? Well, we should ask ourselves what a maverick would do and do that. Or watch these videos for inspiration...
If those don't make you laugh...just remember my fellow mavericks...this too shall pass.
Later Trades,
MT
Thursday, October 09, 2008
What I'm Researching...
| Posted: 08 Oct 2008 12:27 PM CDT examples of barplotting in R - color the bars, horizontal axis, stacked bar graph, and side by side graphs. |
| R Functions and Procedures We Should Know Posted: 08 Oct 2008 12:26 PM CDT common functions in R - just a brief command set. |
| Gmail, Weather, Beauty on your Ubuntu Desktop | Quick Tweaks Posted: 08 Oct 2008 11:59 AM CDT very cool desktop for ubuntu. |
Wednesday, October 08, 2008
What I'm Researching...
| Linus' blog: .. so I got one of the new Intel SSD's Posted: 07 Oct 2008 10:02 PM CDT great analysis on evaluating SSD hard drives. read the comments for more info. as an aside...linus has a blog...cool. |
| Posted: 07 Oct 2008 12:45 PM CDT monte carlo in python? looks worth exploring further. |
Tuesday, October 07, 2008
What I'm Researching...
| The Sect of Homokaasu - The Rasterbator Posted: 07 Oct 2008 01:45 AM CDT Cool, print huge posters from normal paper - software breaks up images to fit on 8.5 x 11 paper. Hat-tip to my wife for finding this site. |
| Posted: 06 Oct 2008 12:43 PM CDT Great site covering formulas of investment stats. Useful for coding the performance part of the testing platform. |
| pickle(cPickle) vs numpy tofile/fromfile - Python - Snipplr Posted: 05 Oct 2008 11:09 PM CDT interesting code snippet comparing performance of cpickle and numpy to/from file routines. been thinking about this lately...using numpy directly or cpickle instead of using a bloated dbms for persistent storage of time series on the testing platform. |
| HintsForSQLUsers - Hierarchical Datasets in Python Posted: 05 Oct 2008 11:06 PM CDT covers many of the faq of SQL developers when developing with PyTables. |
| EasyvizDocumentation - scitools - Google Code - Easyviz Documentation Posted: 05 Oct 2008 09:55 PM CDT Python plotting interface to various backend plotting engines: Gnuplot, Matplotlib, Grace, Veusz, PyX, VTK, VisIt, OpenDX, and a few more. Seems like a fairly straight-forward interface. And choosing the backend used is a one-line import statement. Interesting. |
| Posted: 05 Oct 2008 12:25 PM CDT looks like a dead-simple plotting library in python to produce pub quality pdf/ps images. Need to explore. |
Sunday, October 05, 2008
What I'm Researching...
| Posted: 05 Oct 2008 12:12 AM CDT WYSIWYG Javascript WYSIWYG editor - haven't tried it...but may be worth testing on a new project of mine. |
| PyTables - Hierarchical Datasets in Python Posted: 04 Oct 2008 01:35 PM CDT the original python interface to the HDF5 library. Have tested this before...need to test again using new architecture. Original tests found speeds that were equivalent to SQLite but of course slower than CSV files. |
| Python bindings for the HDF5 library — h5py v0.3.1 documentation Posted: 04 Oct 2008 01:33 PM CDT a python interface to the excellent HDF5 library. worth testing in project. |
| Posted: 04 Oct 2008 12:24 PM CDT enjoyed reading this guy's take on Erlang. Of course, he had me with quoting Unix philosophy, "Do one thing and do it well." |
| Optimal RAID setup for SQL server - Stack Overflow Posted: 04 Oct 2008 10:35 AM CDT Excellent Q&A on choosing the optimal RAID config for disk i/o performance. By the by, stackoverflow is an awesome site for programmers!!! |
Saturday, October 04, 2008
What I'm Researching...
| Posted: 03 Oct 2008 11:45 PM CDT breaks down the colors available to R - both number and symbolic name. |
| Posted: 03 Oct 2008 11:29 PM CDT Great examples of barplots in R. |
| Dabbleboard - Online whiteboard for drawing & team collaboration Posted: 03 Oct 2008 12:59 PM CDT Awesome drawing application - auto-recognizes shapes and smooths lines from raw drawings. Great tool for flowcharting, room designs, etc. |
| ode Like a Pythonista: Idiomatic Python Posted: 29 Sep 2008 09:21 PM CDT takes the basics of python up a notch. definitely pay attention to the dictionary and advanced string formatting examples. |
| My no-server personal wiki—Part 3 - And now it’s all this Posted: 02 Oct 2008 11:18 PM CDT Describes in detail how to design a personal wiki. I enjoyed reading the design...I've built a similar html document system in the past. But, never added the markdown features. May have to try this out. |
Monday, September 29, 2008
What I'm Researching...
| InterfaceLIFT: Wallpaper sorted by Date Posted: 29 Sep 2008 01:05 AM CDT awesome desktop wallpapers - free download. |
| Personal Finance Assistance « ActiveState Code Posted: 28 Sep 2008 03:41 PM CDT great code example of using python and sqlite. |
| Posted: 28 Sep 2008 12:34 PM CDT brief coverage of constructing, indexing, slicing, and summation of arrays. |
Sunday, September 28, 2008
What I'm Researching...
| Python/CDAT for Earth Scientists: Tips and Examples Posted: 28 Sep 2008 01:15 AM CDT great cookbook covering python & numpy. hat tip to the Smooth blog. Covers plotting, reversing arrays, etc. |
| Array creation — NumPy v1.2 Reference Guide (DRAFT) Posted: 28 Sep 2008 01:08 AM CDT Covers creating arrays in NumPy - covers recarrays. to create recarray: x = np.array([(1.0, 2), (3.0, 4)], dtype=[('x', float), ('y', int)]). Then to view as recarray: x = x.view(np.recarray). x.x |
| NumPy Reference Guide (DRAFT) — NumPy v1.2 Reference Guide (DRAFT) Posted: 28 Sep 2008 01:00 AM CDT great reference guide to using NumPy. |
| http://conference.scipy.org/static/wiki/demo_numpy2.py Posted: 28 Sep 2008 12:08 AM CDT example of creating structured arrays in numpy. |
| Posted: 27 Sep 2008 01:16 PM CDT a great resource for SQLite. |
Friday, September 26, 2008
What I'm Researching...
| Posted: 26 Sep 2008 01:37 AM CDT Simple tutorial in R from a finance perspective. |
| Posted: 26 Sep 2008 01:27 AM CDT excellent guide to tuning SQLite. Need to try some of this stuff. |
| Posted: 26 Sep 2008 01:14 AM CDT very comprehensive tutorial on R language. Covers plotting, creating functions/classes/methods, parallel programming, optimizations, etc. Great coverage of databases (sqlite). |
| R Graph Gallery (65) Bollinger Bands Posted: 26 Sep 2008 12:54 AM CDT great example of R stock charting. |
| Reading and Writing Data in R (pdf) Posted: 26 Sep 2008 12:51 AM CDT great primer on reading/writing large files in R language. |
| R functions to read ASCII price series Posted: 26 Sep 2008 12:34 AM CDT several functions to read price series in ASCII format. |
| Posted: 26 Sep 2008 12:30 AM CDT R functions for interacting with the CSI Data platform |
| R: Econometric tools for performance and risk analysis. Posted: 25 Sep 2008 03:34 PM CDT performance analysis library covering the whole gamut of performance and risk analysis functions. |
| TWiki - the Open Source Enterprise Wiki and Web 2.0 Application Platform Posted: 25 Sep 2008 12:27 PM CDT one of the wikis to consider. |
| Posted: 25 Sep 2008 12:23 PM CDT cool themes for TiddlyWiki |
Thursday, September 25, 2008
What I'm Researching...
| Groovy Domain Specific Language Tutorial « InnovationStartups Posted: 24 Sep 2008 12:50 PM CDT nice example of a stock trading DSL. Not familiar with Groovy...research more. |
| Non-Programmer's Tutorial for Python/Contents - Wikibooks, collection of open-content textbooks Posted: 24 Sep 2008 12:55 AM CDT Great tutorial on python. - love the format. |
| Posted: 23 Sep 2008 11:15 PM CDT another interesting plotting package in R language. |
Tuesday, September 23, 2008
Barplot function in R
Since I'm using python...figured I had to give the matplotlib library a try. It is nice...simple...but something was missing. Couldn't put my finger on it. So, dug around and played with the R language plotting libraries. A bit more my speed...though a bit particular in the settings. Anyway, here's a function I wrote to generate bar charts using R with a replacement for pie charts in mind...
#-----------------------------------------------------------------
# Simple bar chart - use instead of pie chart when possible.
#-----------------------------------------------------------------
barPie <- function(xSeries, chTitle="Your Bar Chart", xLab="X Label",
                     xDesc="%")
{
 xSeries <- sort(xSeries)

 # save off original settings in order to reset on exit
 oldPar <- par(no.readonly=TRUE)

 plot.new()

 # set page margins in inches
 par(mai=c(1,1.5,1,1))


 # pad 30% for labels
 # start plotting at 0.0 unless negative
 if (min(xSeries) < 0.0)
 {
     xLim = c((min(xSeries) * 1.3), (max(xSeries) * 1.3))
 }
 else
 {
     xLim = c(0.00, (max(xSeries) * 1.3))
 }

 # horizontal barplot in color baby!
 bp <- barplot(xSeries, horiz=T,
       xlab=xLab, las=1, col=rainbow(length(xSeries)),
       xlim=xLim,
       axes=F, cex.names=0.7, main=chTitle)

 # if x negative then start label at 0.0
 # otherwise, start label at value of x.
 xVals = ifelse(xSeries < 0.0, 0.0, xSeries)
 text(xVals, bp, paste(xSeries, xDesc, sep=""),pos=4, cex=0.65)

 # format x axis
 xRange <- formatC(pretty(xSeries), 1, format="f")

 axis(1, at=xRange, labels=as.character(xRange), cex.axis=0.75)
 box()

 #restore par value to previous state
 on.exit(par(oldPar))
}
Used data from my portfolio to plot sector allocations and called the function...
sectors <- c(10.64,119.83,162.66,66.48,71.78,35.44,32.77,161.17,53.91,
               101.81,53.38,231.45,31.24,103.01)
sectors <- round((sectors/sum(sectors)*100.00), 1)

# write to png driver
png("c:/taylortrade/rlang/sectors_test.png")

barPie(sectors, "Sector Allocation", "Pct Allocated")

# stop writing to png driver
dev.off()
And here's the result...
What I'm Researching...
| Visualize real-time data streams with Gnuplot Posted: 22 Sep 2008 11:26 PM CDT perl script feeding Gnuplot to plot streaming data in real-time. Interesting find...hat tip to Hackszine.com |
| Posted: 22 Sep 2008 10:21 PM CDT need to review this...looks like an all encompassing plotting package for the R language. Barcharts, piecharts, gantt charts, oh my! |
Monday, September 22, 2008
What I'm Researching...
| Posted: 21 Sep 2008 09:28 PM CDT the how-to of creating extensions to the R language. |
| The Hazel Tree - A Python Compendium Posted: 21 Sep 2008 07:21 PM CDT central location of texts covering python. |
| Posted: 21 Sep 2008 06:25 AM CDT R language package containing functions for ohlc plots, sharpe ratio, sterling ratio, maxDrawDown, rolling analysis, ema, sma, emwa, etc. |
Sunday, September 21, 2008
What I'm Researching...
| Posted: 21 Sep 2008 01:37 AM CDT nice site covering all the R essentials - reading data, graphing, stats. |
| Posted: 21 Sep 2008 01:28 AM CDT search the R language mailing list. |
| Posted: 21 Sep 2008 01:26 AM CDT cookbook of the R language |
| Producing Simple Graphs with R Posted: 20 Sep 2008 10:47 PM CDT examples of various charts (line, bar, pie, dot, histogram) in R language |
| Creating Charts and Graphs with GNU R Posted: 20 Sep 2008 10:45 PM CDT brief tutorial covering pie, bar, scatter, and line charts in R language. |
| R Graph Gallery :: List of graphs Posted: 20 Sep 2008 10:26 PM CDT great gallery of R Language graphs. |
| Posted: 20 Sep 2008 10:16 PM CDT gallery of R language graphics by category such as Finance, Econometrics, SocialSciences, etc. |
| Posted: 20 Sep 2008 10:13 PM CDT book on the graphics available with the R language. Very nice! |
| Posted: 20 Sep 2008 10:12 PM CDT table of colors available in R language. |
| Using Color in R Language (pdf) Posted: 20 Sep 2008 10:10 PM CDT showcases all the colors available in graphing with the R language. |
| Getting Started With Matplotlib's OO Class Library Posted: 20 Sep 2008 08:34 PM CDT brief summary of matplotlib's api. |
| Using Python for Interactive Data Analysis Posted: 20 Sep 2008 08:26 PM CDT Several excellent examples of using numpy and pylab (matplotlib) together. |
| scienceoss.com » Blog Archive » Creating a custom bar plot in matplotlib Posted: 20 Sep 2008 03:33 PM CDT interesting code examples of bar charts in pylab. |
Friday, September 19, 2008
What I'm Researching...
| Posted: 18 Sep 2008 11:20 PM CDT api reference for matplotlib - not a cookbook of examples - just command and descriptions. Use as reference guide. |
| Posted: 18 Sep 2008 11:13 PM CDT drop-dead example of plotting with pylab versus matplotlib's api. would like to use pylab's api...if at all possible. |
| Sofeng's Blog: Simplistic Python Thread example Posted: 18 Sep 2008 11:02 PM CDT drop-dead example of threading in python. |
| Sofeng's Blog: How to use *args and **kwargs in Python Posted: 18 Sep 2008 10:59 PM CDT drop-dead simple explanation of variable length argument lists in python. |
| Sofeng's Blog: Emacs 22 Command Index (sorted by Category) Posted: 18 Sep 2008 10:58 PM CDT breakdown of emacs commands - not sure if format is the best...but worth saving for future. |
| Sofeng's Blog: Example pie charts using python and matplotlib Posted: 18 Sep 2008 10:38 PM CDT really like the look of these pie charts. use for sector allocation page. |
| Sofeng's Blog: How to draw a simple line using python and the matplotlib API - Posted: 18 Sep 2008 10:34 PM CDT drop dead simple example of using matplotlib. |
| Goldblog - Python - Creating Bar Graphs with Matplotlib - Corey Goldberg Posted: 18 Sep 2008 10:20 PM CDT example of bar graph in python. like the format of the graph. |
| Posted: 18 Sep 2008 01:04 PM CDT nice summary of the top shortcuts used in vim. |
Thursday, September 11, 2008
Portfolio Performance for August 2008
Back in Texas, it's usually some of the hottest times of the year. But, feels like Fall already in Mid-Mo.
Can't wait to see the leaves turn colors. Of course, my kids are looking forward to piles of leaves to jump and play
in.
Maybe this weather change will bring the market out of the doldrums. By the way, the picture above was taken while visiting the Devil's Ice Box.
And now for the August returns...
Still, nothing going on with the market or the trading system. Though, plenty to do with the system testing platform. I'm exploring the numpy library for python to determine how big a role this library should play in the platform's architecture. For those curious...check out my delicious bookmarks on numpy.
Later Trades,
MT
Thursday, August 21, 2008
Sector Allocations for August 2008
Saturday, August 09, 2008
Portfolio Performance for July 2008
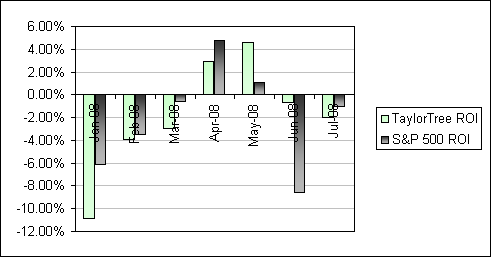
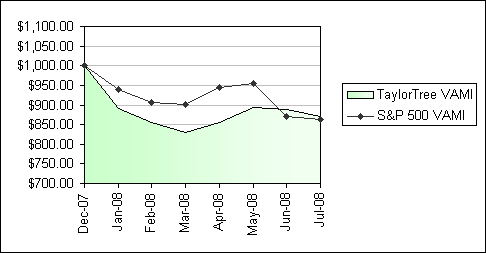
I had a set back this month in regard to the testing platform. The redesign has severely extended the simulation runtime. So, I've spent much of my time finding the bottlenecks of the code and determining the optimal solutions. Very thankful python has such great profiling tools at the ready.
You know, performance tuning code is sure a lesson in humility. All my years of programming...I feel I should have a good handle on the slow areas of my code. It only takes a profiling report to show how wrong I am.
Very similar to trading the market. Trading decisions are based on our experience. Where we think the money-making opportunities are. Only takes a simple backtest to showcase how wrong we are.
And with that...some charts for the month of July...


Not a whole lot of movement in the portfolio occurred the month of July. Just another month of sitting and waiting. Letting the system do what it does best...waiting for the market's next move.
Later trades,
MT
Tuesday, July 08, 2008
Portfolio Performance for June 2008
June wasn't as great for the portfolio. But, did manage to beat the market for the month by a fairly large margin putting us in the lead for the first time this year. I believe a big reason for this outperformance was due to the pulling of weeds back in March and April. This allowed new positions to take hold in the portfolio garden.
Goals for the month of July?
- Complete the upgrade that will enable testing of multiple systems against a common portfolio. This will allow exploration of various allocation methods. And judge the effects of merging long-term systems (trend capturing) with short-term systems (volatility harvesting).
- Wrap-up the upgrade that allows ranking of signals and existing positions in order to initiate trades.
- Modify how cash is tracked in the testing platform. Currently, cash is a static variable. Goal is to convert cash into a unit series to enable dynamic pricing. This will enable sweep accounts in the portfolios. And allow the switching of cash instruments.
Later Trades,
MT
Monday, June 02, 2008
Portfolio Performance for May 2008

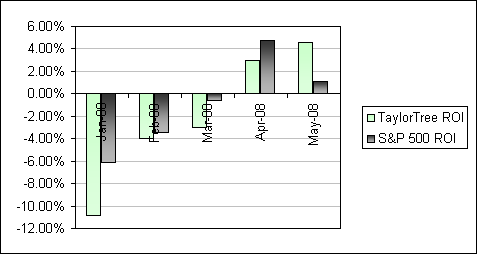
As you can see, the past two months have been the best months of the year for the portfolio. Still not great...but much better than before. In fact, in the chart below, you can see the portfolio's monthly return finally beat the market for the first time this year.

You might have noticed a change in the charts from the prior month's reporting. That's due to a change in Icarra's chart rendering methodology. This new methodology proved more difficult to post images to this blog. So, I rolled my own portfolio software. Which is definitely a work in progress. Over time, I hope to develop the capabilities to track and share more details on trade statistics from this software.
My ultimate goal is to merge my backtesting application with this portfolio software. This way I could compare simulated results with real-time performance.
What are my next investment experiments?
- I'm curious how the elements of permaculture can be used in selecting investment vehicles for the portfolio.
- Would Janet Brown's investment methodology improve my system results?
- When receiving a large number of buys for a given sector...is it better to buy as many stocks as I can under my risk limits? Or more appropriate to opt-out of all the individual stocks and buy an ETF in that sector to capture the obvious sector-based trend?
- Measuring systems that utilize different levels of cash throughout their system life cycle. If system A's performance is better at all conventional levels (Sharpe, ROI, etc.) than system B's...yet system B uses 50% less cash...are the comparisons valid? I don't believe so...but how do you compare then? Via converting unused cash to utilize market-based returns? This is a tough one.
Later Trades,
MT